Taking A Deep Dive Behind the Curtain
Giving the Users a Voice
I conducted user research to understand who the users were, what their feelings were surrounding the app and at large, and why they used–or didn't use–the app.
The Problem: An Outdated App Without Users
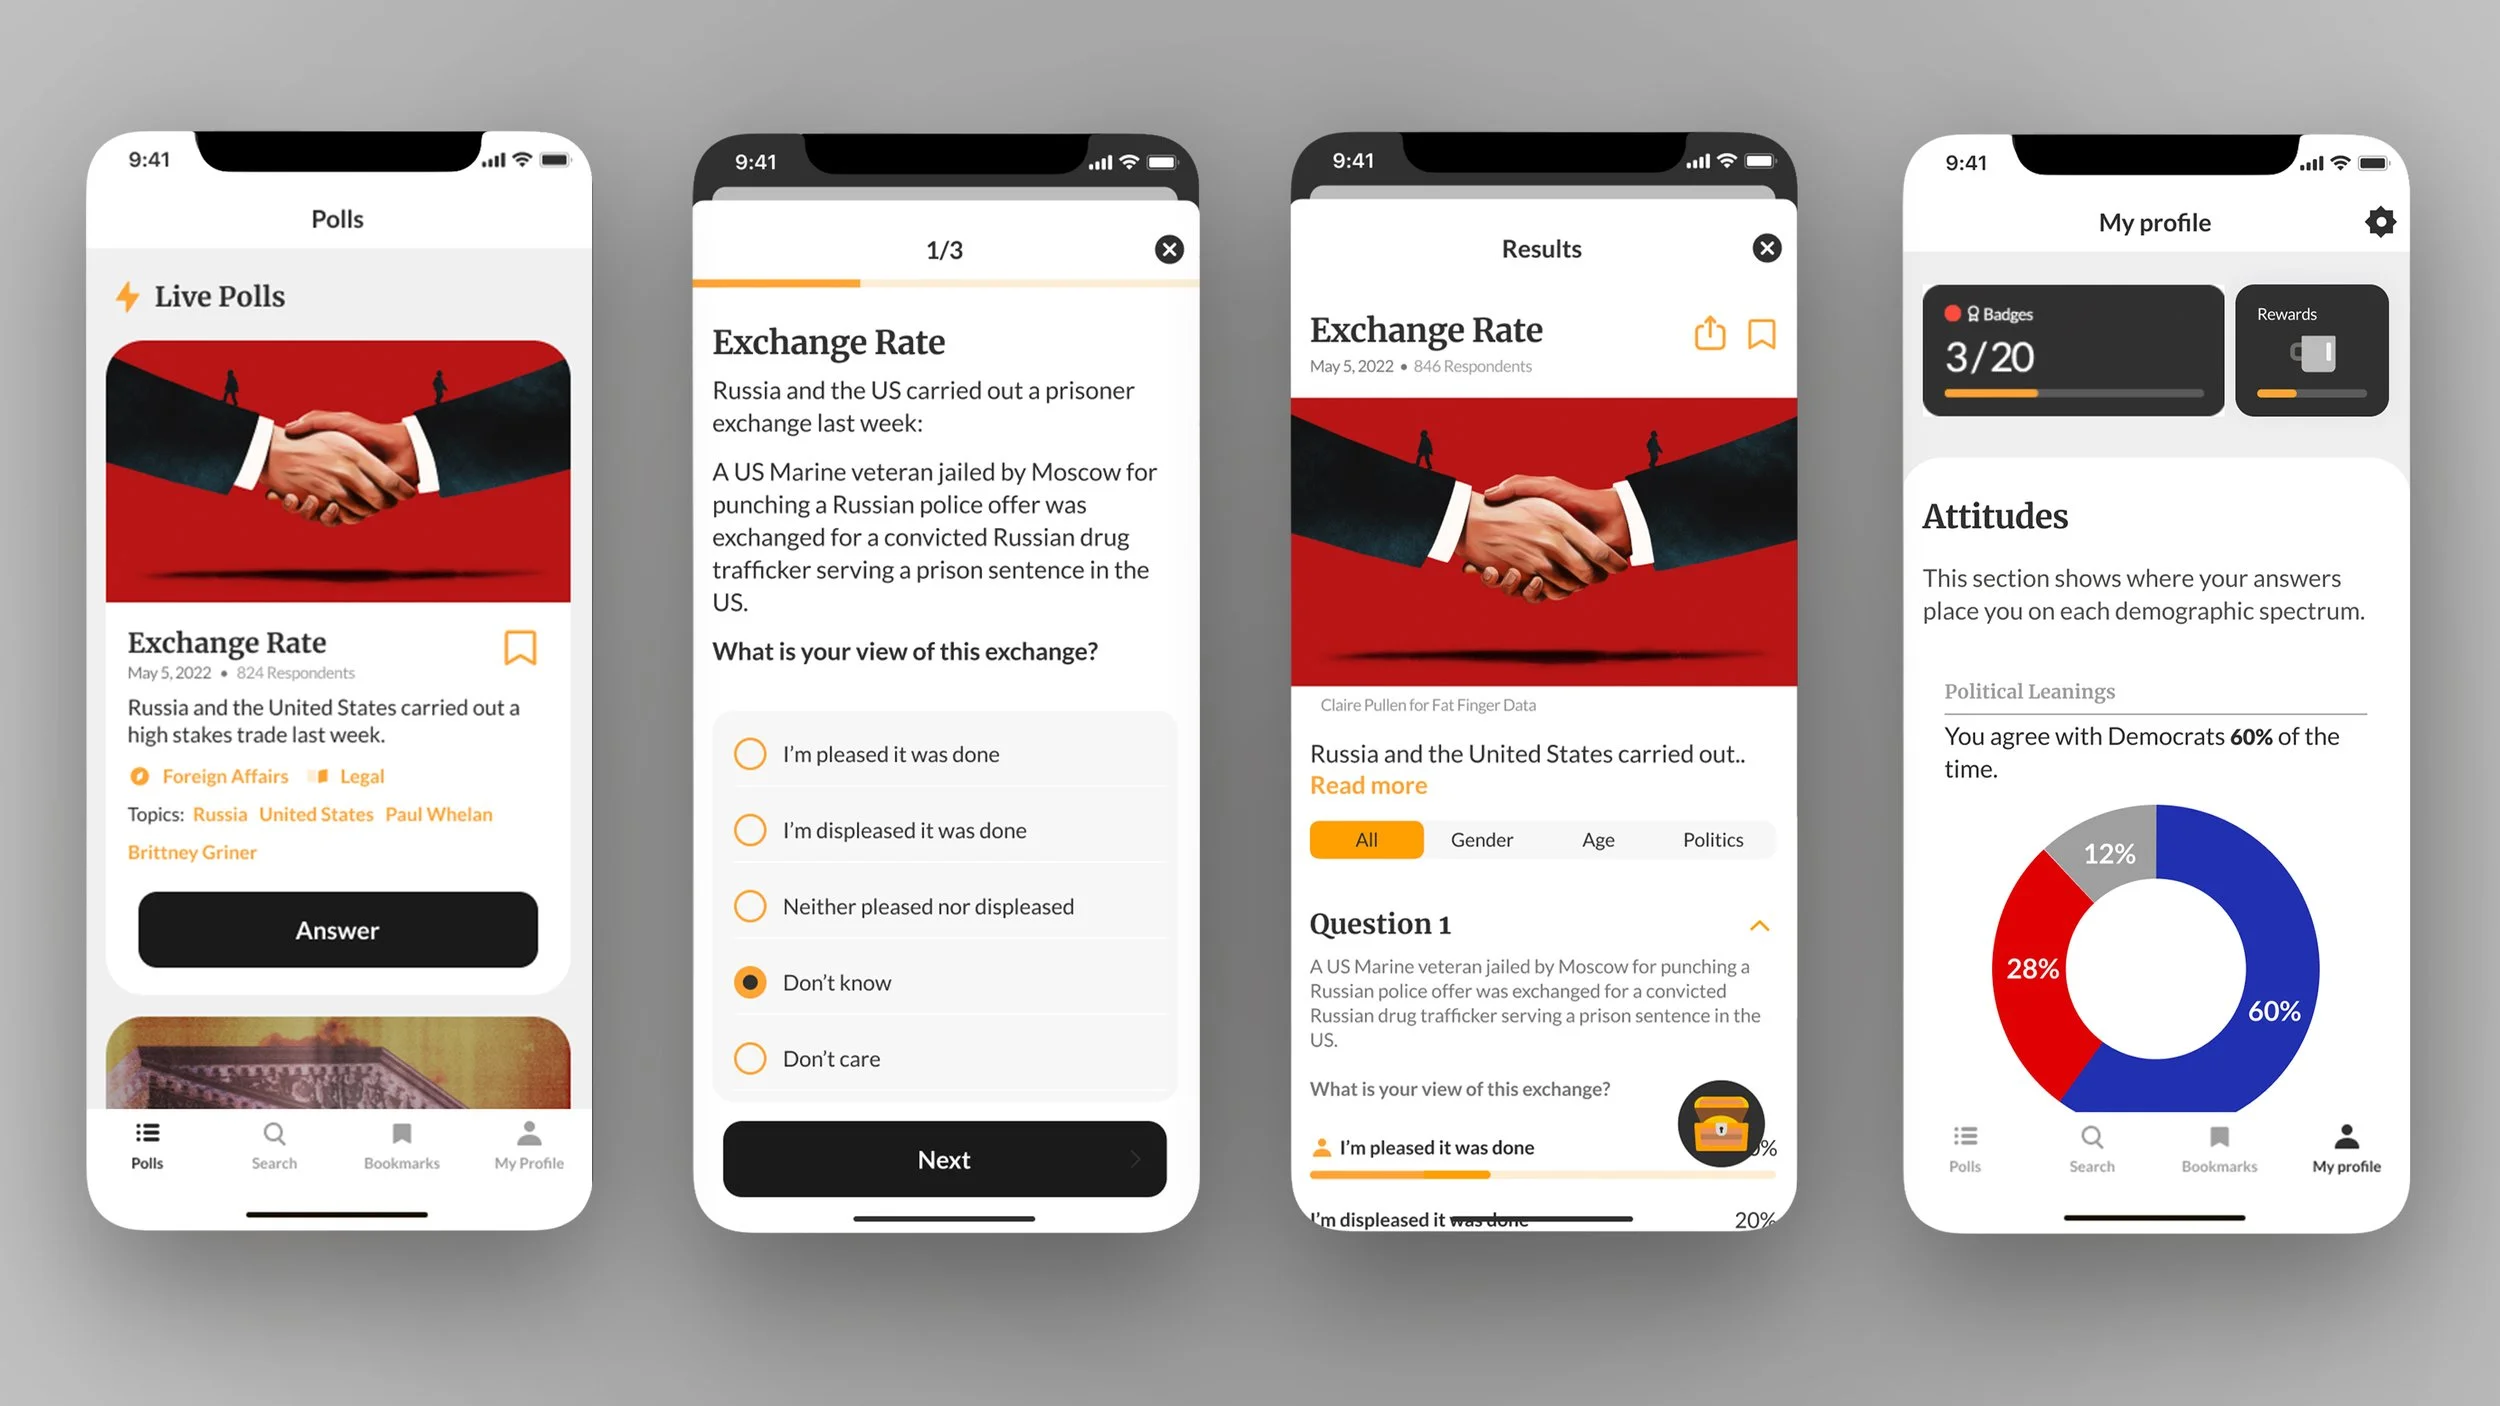
The app was basic and outdated, making it frustrating to use and not up to usability standards, stunting its usefulness. Although the founder recognized the need for an overhaul, the original developers were no longer involved and there was no dedicated team to implement changes.
These issues led to low respondenses to the polls and an overall small userbase—after eight years, it still was averaging under 200 respondents per poll.
As a result, it was necessary to address the app's usability and interface issues in order to improve engagement and increase the user base.
Goals
Methodologies
"People are so divided and aren't informed on how people outside of their silo feel, the polls and their data provide insights, inform decisions and empower respondents...Public opinion has not been consumed by the masses, the app makes it easy to know how people feel immediately and easily."
"People can make more informed decisions, daily and in larger scheme, have better understanding of your fellow humans’ opinions and outlooks, get real data on the day’s big topics from unbiased source."
"A mobile, on the go resource resource full public opinions; a digital space to express your opinions and compare your ideas with others."
"I would love to be the place to go for the question of the day, for people of all backgrounds and demographics to come to FF to share their opinions and to see what people think about any topic."
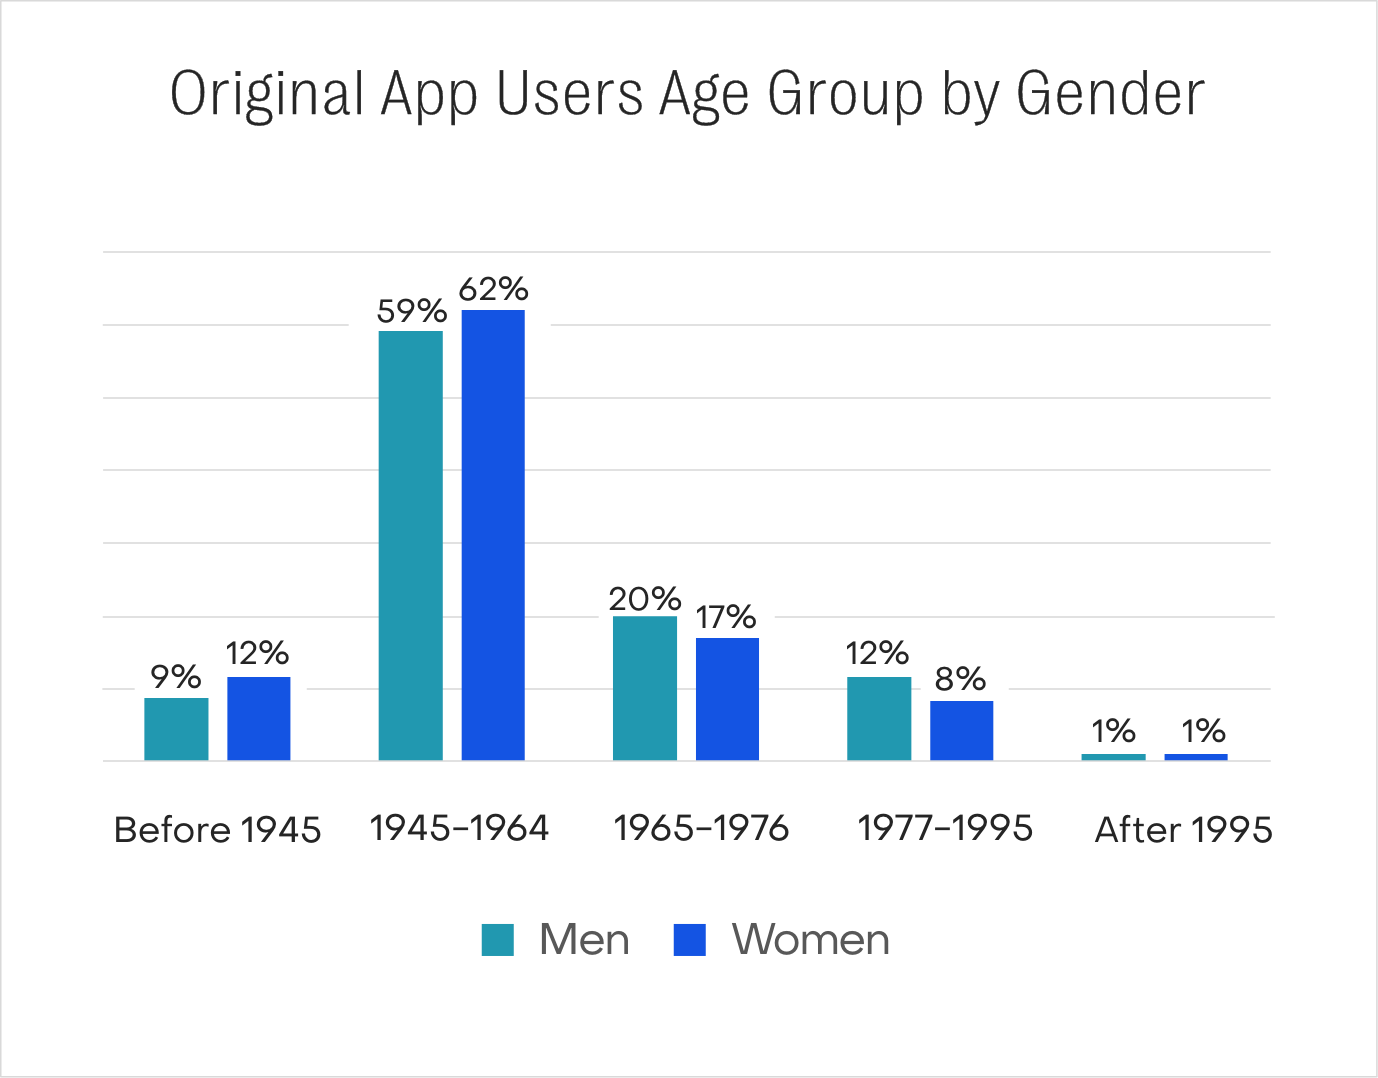
I analyzed the user data based on respondent demographics and found a large majority of the users were older, with the largest age group being those born 1945-1964, and 58% of the users were men.
The founder wanted to see a more diverse user base, especially an increase in younger users.
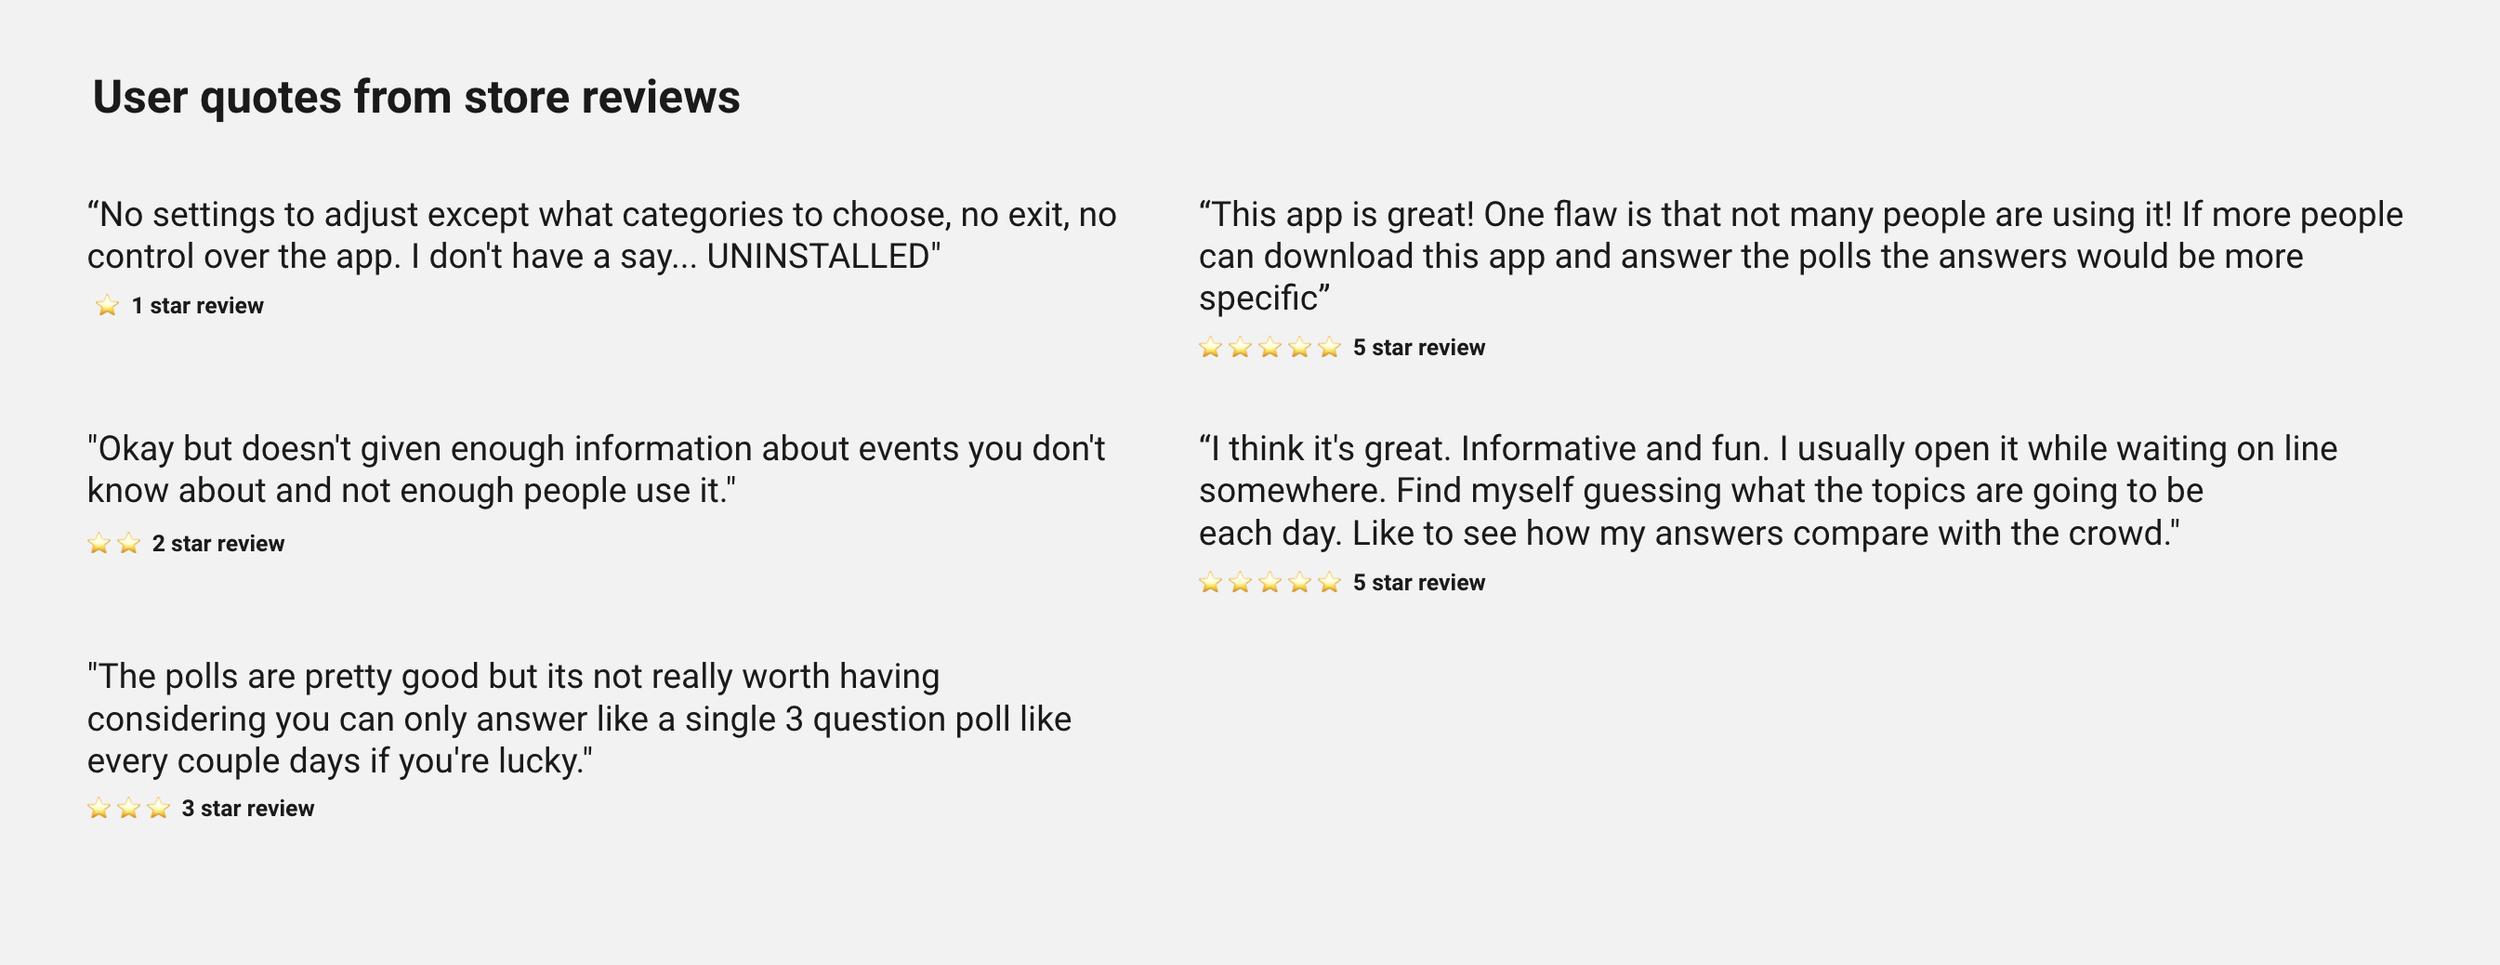
I went through reviews on both the Apple App Store and the Google Play Store, creating a master spreadsheet that contained direct quotes, a notation if it was a compliment, complaint, or both, as well as a summary of the users feelings or suggestions. I disregarded comments that addressed specific editorial topics unrelated to the app's experience.
Good news first–I saw that the majority of users had something positive to say about the app, with 56% of the overall reviews containing a compliment, and 30% of them being solely positive.
They liked to "err political grievances" and "see how others [opinions] compare to my own."
Overall, they took the polls to opine, get catharsis from sharing their thoughts and bolster “their” side.
The bad news was that a majority also had some sort of issue or complaint. Users felt that there wasn't enough control or options for them in the app, and complained of poor performance.
I also was able to see that users wanted more to do, the single 3-question poll every 3rd day wasn't cutting it, and they wanted more people participating.
Using store review comments and feedback, I created three empathy maps that covered different feelings users had about the product and experience.


With a deeper understanding of the users,
I conducted a review of the app
to discover where it app stood in
terms of usability and functionality.
I went through the app with a sieve,
auditing it to understand
what features it already had, and how it was organized. I
conducted a
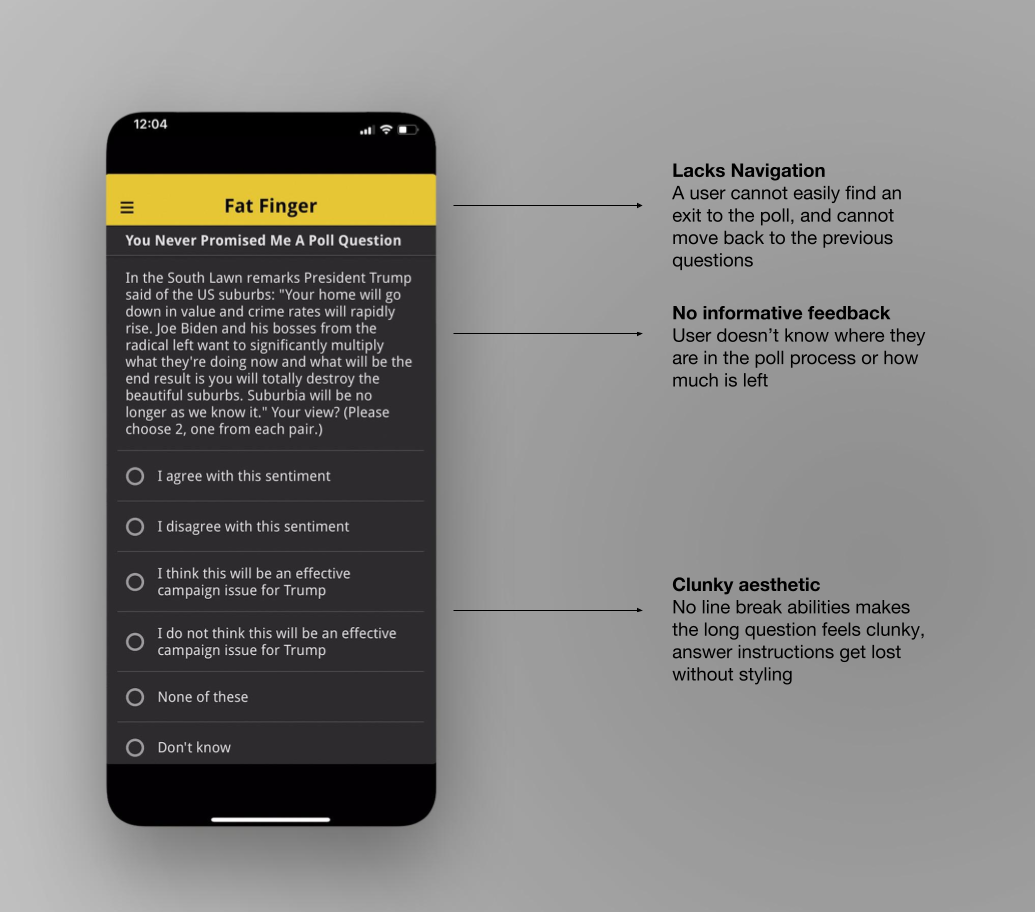
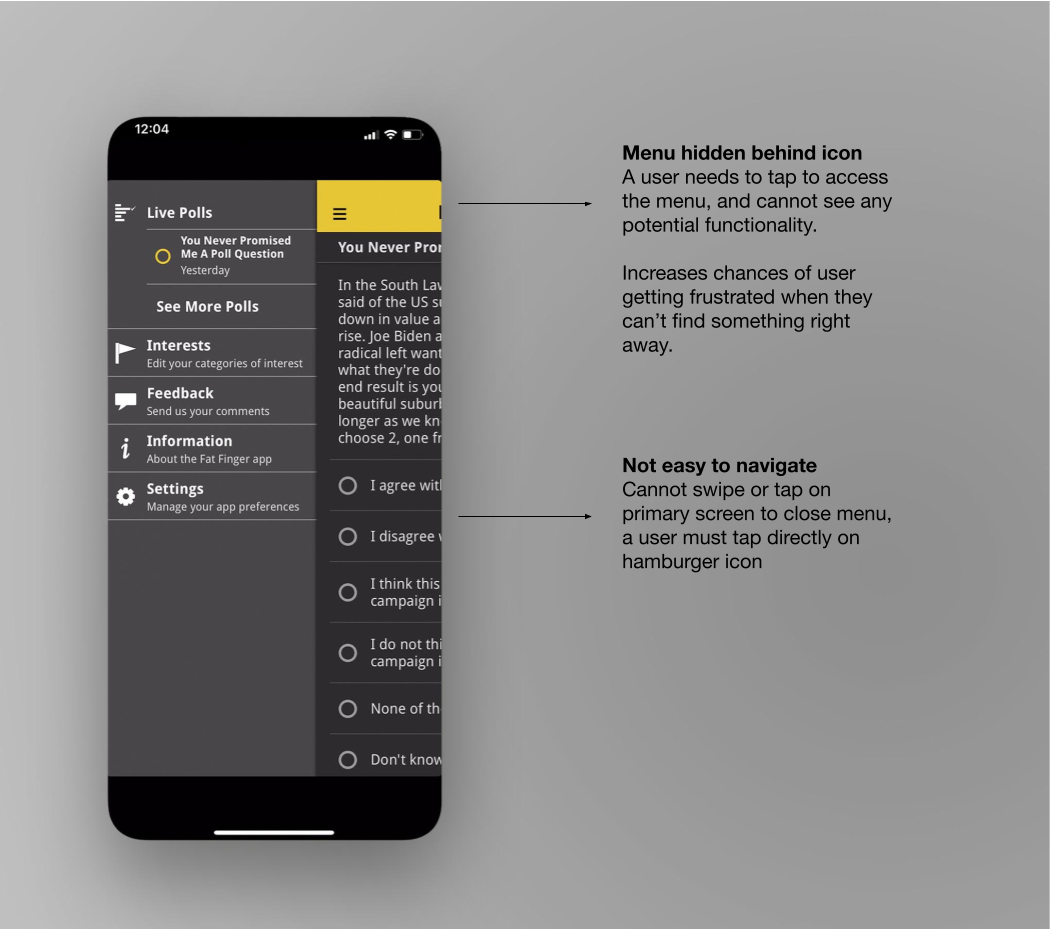
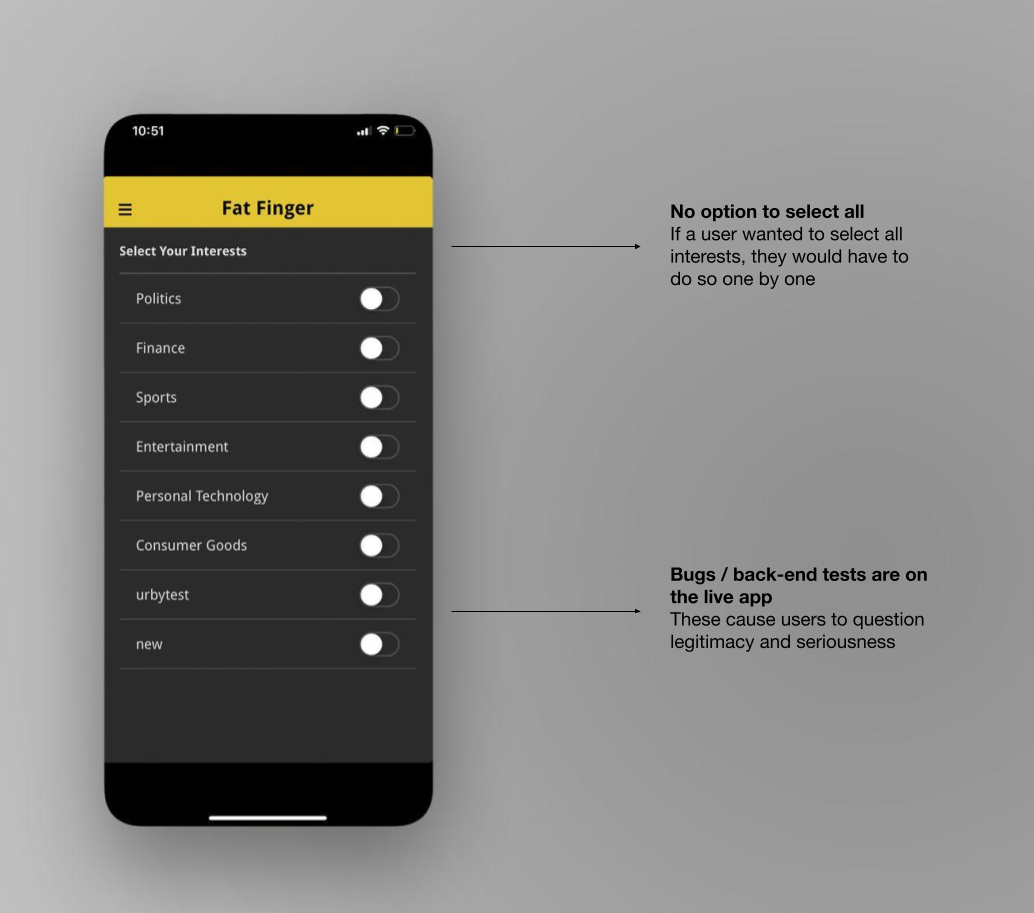
With the users' feedback in mind, I uncovered pain points users were facing while trying to use the app.
After discovery, I was able to understand the scope of the project.
High Level Goals
Desired Outcome
We wanted to update and build upon the existing app to make it an engaging way for people to participate in polls that are pertinent to the public interest, grow the user base and poll response rate, especially amongst younger demographics, and increase overall user satisfaction.
Solution
Our solution was to make the app more usable by addressing pain points, brainstorm new features and more intuitive user flows, harness the full capabilities of the app's past poll data, and adding personalization. We believed these upgrades would help to drive engagement and response rates.
Measures of Success
Limitations
Resources, access to past user data, and a lean budget.
Ideation
After formulating an understanding of the app, its users, their feelings, and the founder's goals, I concluded that the app lacked usability and its value to the user was limited as there weren't any features outside of taking a single live poll every third day and seeing the last ten poll results.
Goals
Come up with new features and improve upon the existing ones that gives users more value, map intuitive user flows and form an architecture that improves the app's usability, and update the app to industry standards.
Methodologies
For the sake of clarity, the ideation and design portions have been organized into individual case studies that cover different sections of the app, with each showing its respective design process.